







Description
My monthly market update, done in 20 minutes
An editable monthly market report for clients and social media.
- 13 report slides
- 6 square social slides
- 10 editable native charts
- Data sheet: 6 tabs
Get Monthly Market Report · $29
Instant download · Editable Slide Template · Digital download · All sales final
You’re here because…
- The month just ended. Your MLS or portal stats have updated, and you promised yourself a market update for your clients this time.
- Last time it took an evening: numbers copied by hand, a chart that was really a picture, and a post that never went out.
- You want it to look professional, but more than that you want it to be right: what does months of inventory really say?
- And you want to explain a slower or faster market honestly, without promising where prices go next.
- Plus the square version for social, from the same numbers.
This kit gives you a 13-slide report and 6 social slides with native charts you can edit, a data sheet that calculates every number once, and this guide: where each figure comes from, the formulas in plain words, and how to talk about the market honestly. About 15–20 minutes a month once your data is in.
What it does for you
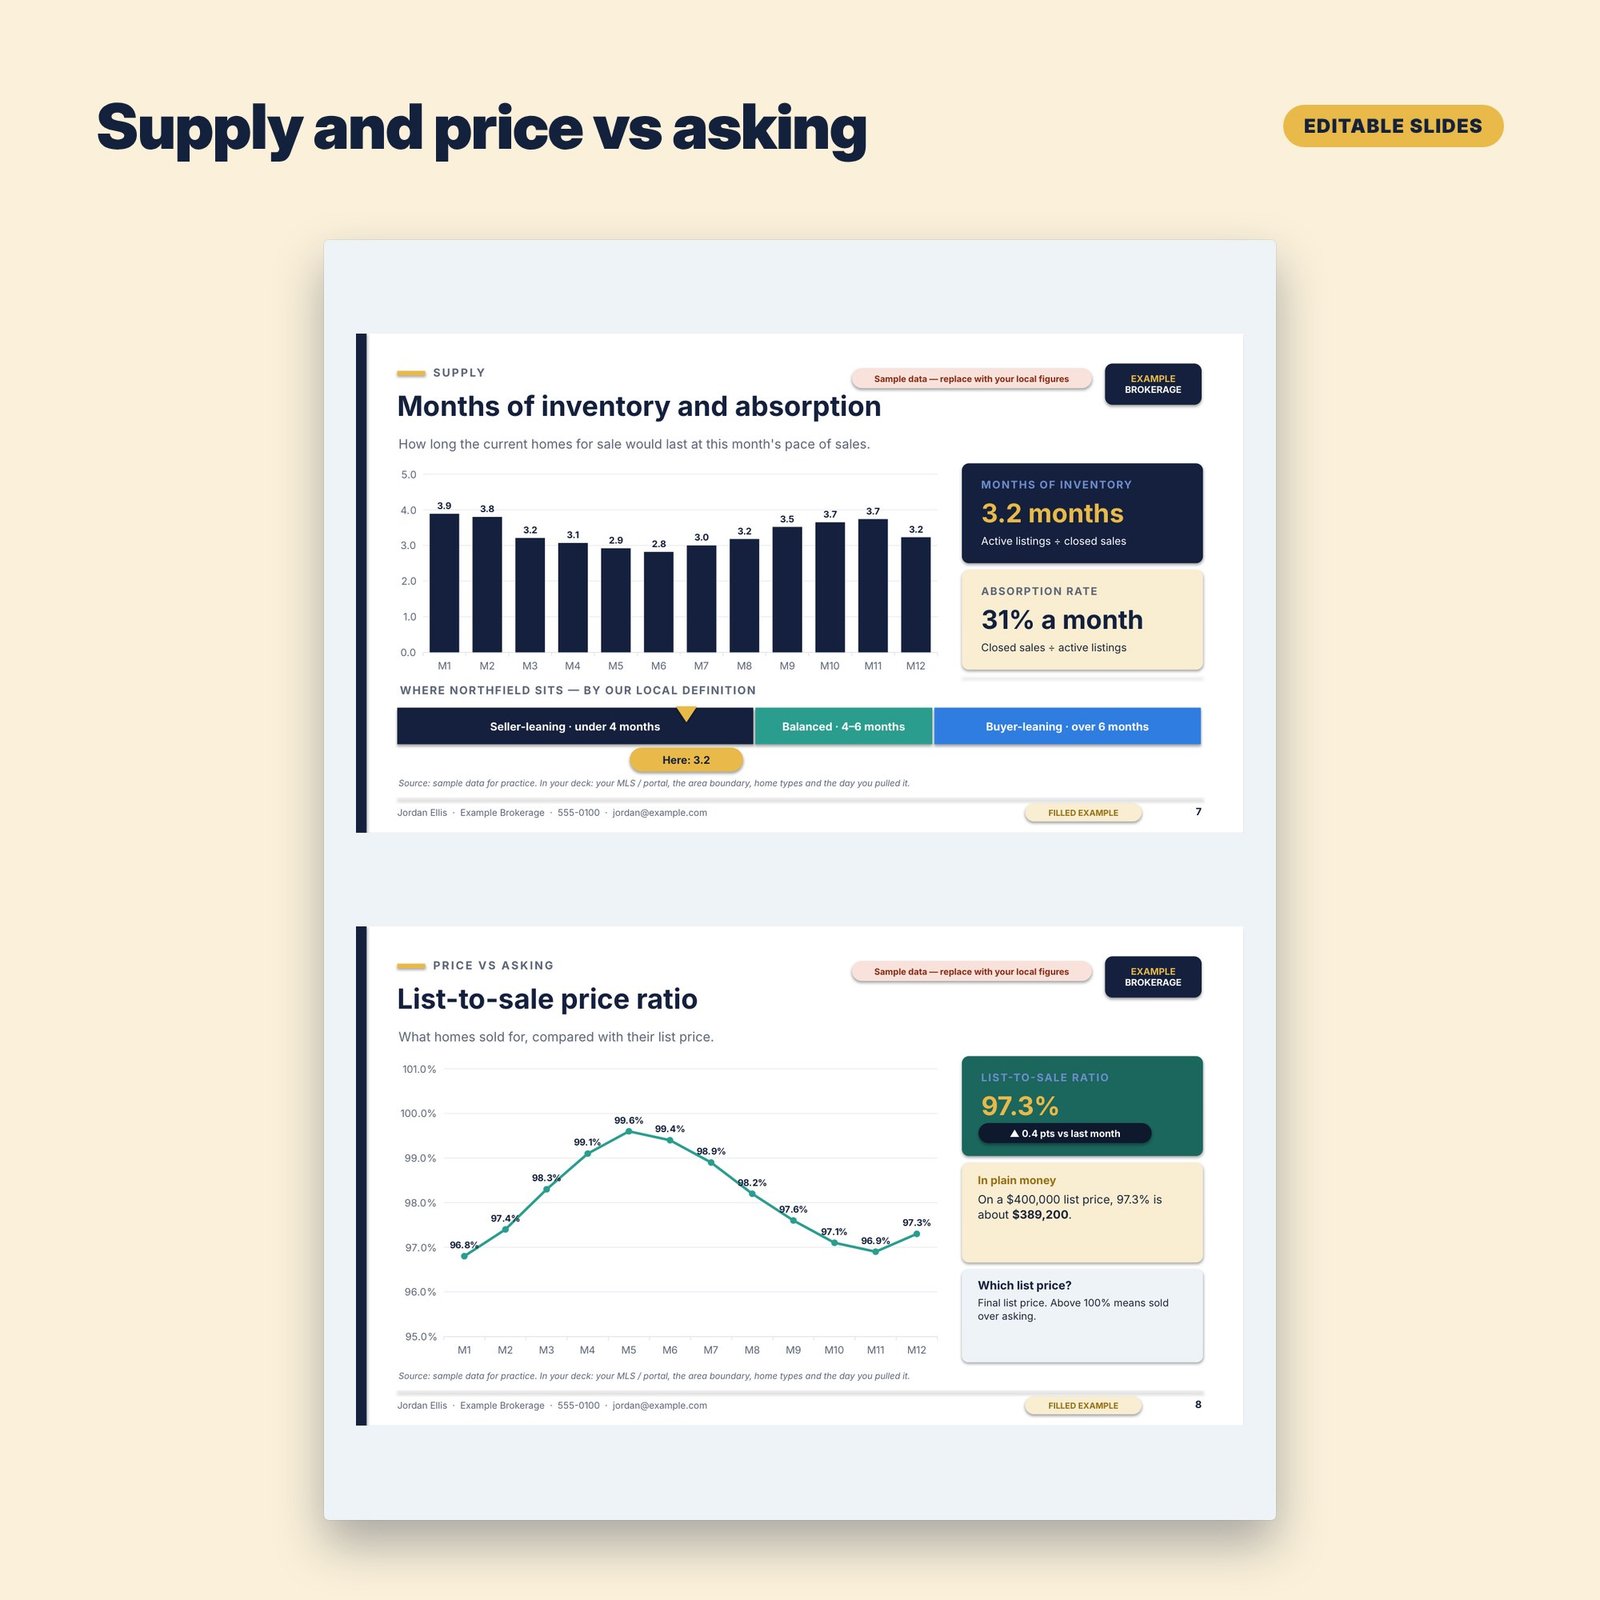
The month just ended, your stats have updated, and you want to send clients something useful: not a forwarded portal email, not a pretty chart that is really a picture. This template gives you a complete monthly report: headline summary, median and average price, sales volume, new listings vs sales, days on market, months of inventory and absorption, list-to-sale ratio, price bands, what it means for buyers and for sellers, your notes and contact.
Type one row a month into the data sheet and it calculates months of inventory, absorption, list-to-sale, sales-to-new-listings and every % change, ready to type on the slides. The charts are native and editable, the speaker notes explain how to calculate each metric from your MLS or portal data, and the guide shows how to talk about the market honestly, without predictions. Sample data is fictional and clearly labelled. Templates and tools. Results depend on your market and your work.
What’s inside
A look inside



How it works
Made for
- Real estate agents and realtors who send a monthly market update
- Agents who want a consistent social media market post
- Team leads who want one honest, branded report format for the whole team
Format
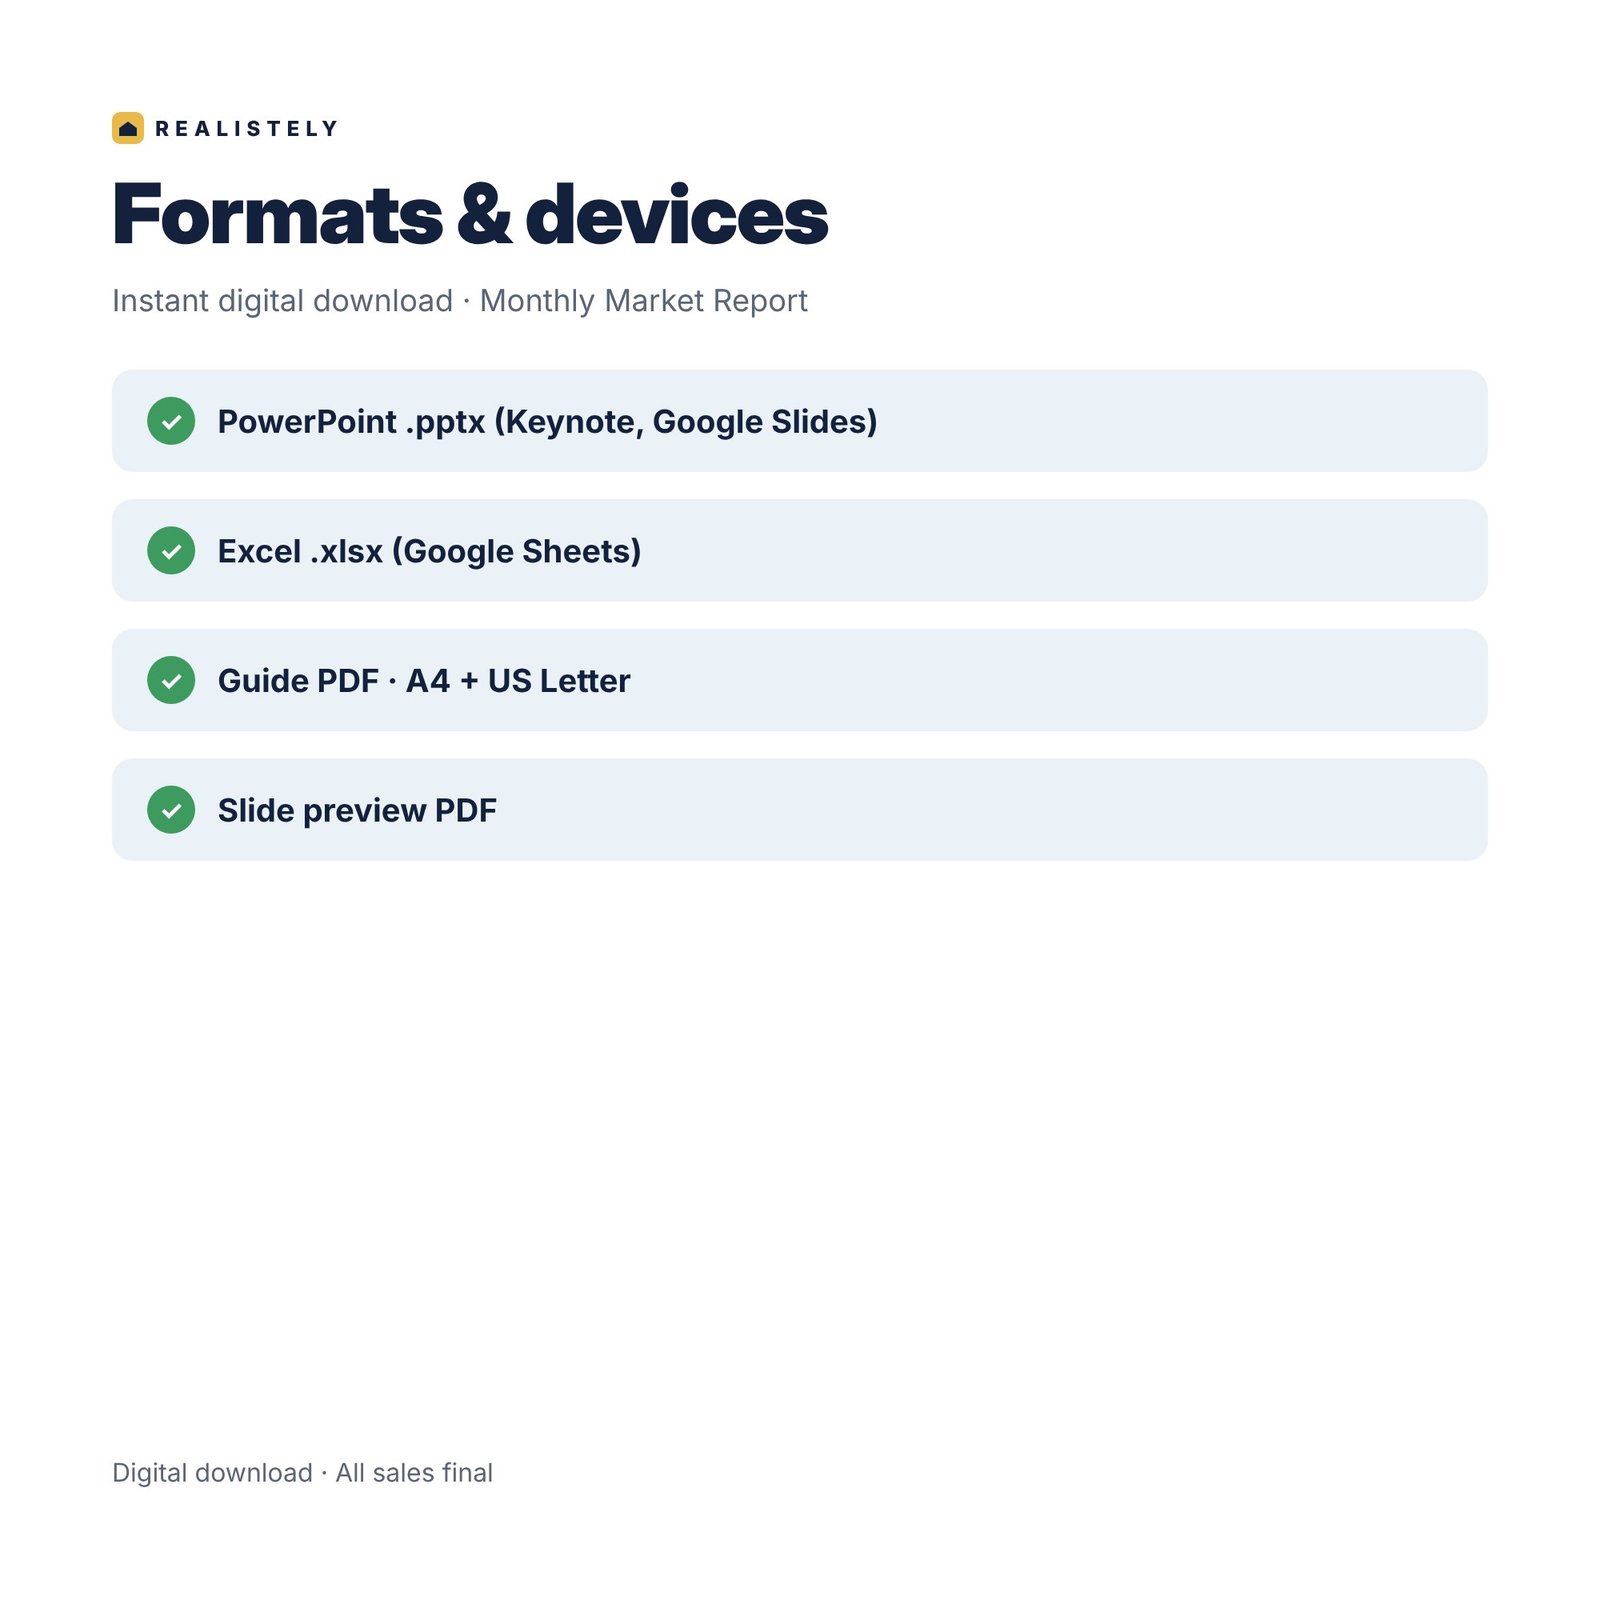
- PowerPoint .pptx (Keynote, Google Slides)
- Excel .xlsx (Google Sheets)
- Guide PDF · A4 + US Letter
- Slide preview PDF
- Instant download
Questions
Which software do I need?
PowerPoint .pptx files. They also open in Keynote and Google Slides, and can be imported into Canva. Every text box is editable.
Can I add my branding?
Yes. Change the theme colours and fonts once, add your logo, name and brokerage, and every slide follows.
Does it work where I live?
It is written for the US, UK and Canada in plain language. Rules differ by country, state and province, so every tool tells you what to check locally.
When do I get it?
Straight after checkout: you get a download link by email and on the confirmation page.
This product alone is $29. Or upgrade and save.

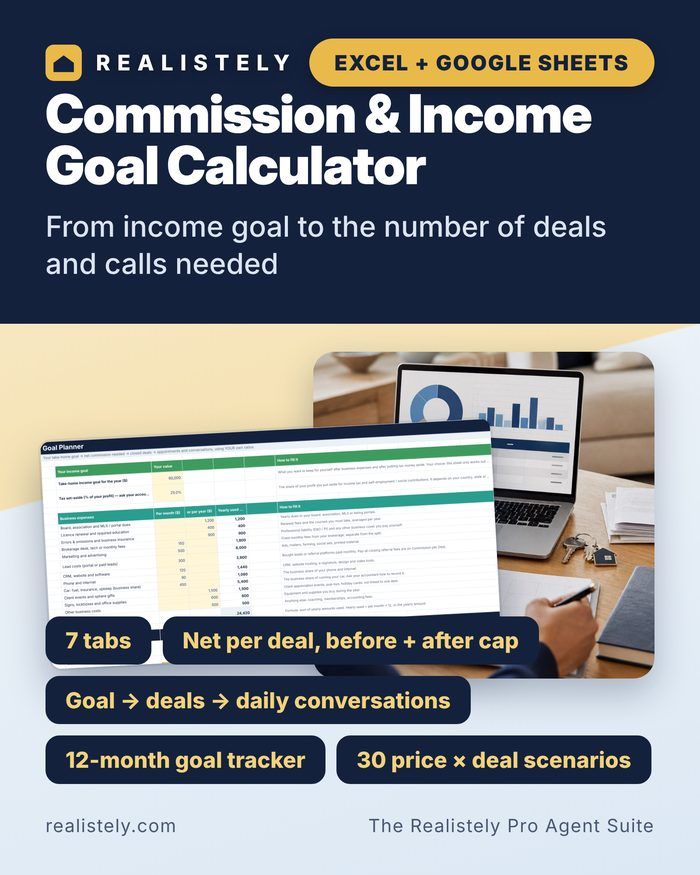
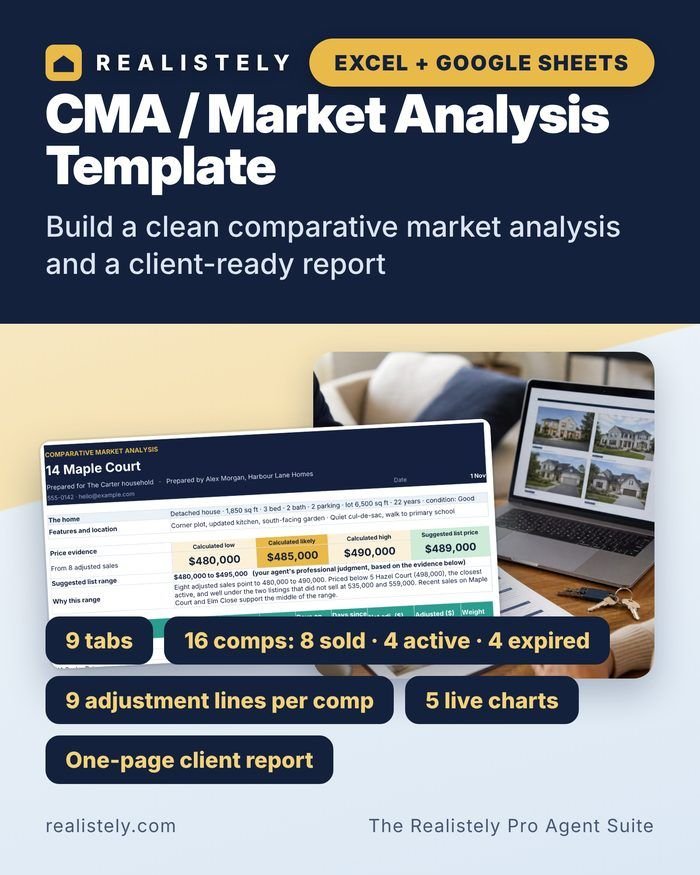
The Realistely Pro Agent Suite
Monthly Market Report + 13 more tools + Start Here + bonus
Same instant download · Digital download · All sales final



Monthly Market Report
An editable monthly market report for clients and social media.
Instant download · Digital download · All sales final
Templates and tools. Results depend on your market and your work. Educational information only, not legal, tax or financial advice. Rules differ by country and state; check your local rules.